How the Fed’s gradual hiking cycle reshaped capital flows and dollar positioning.
By Nouriel Roubini | Economist, NYU Stern
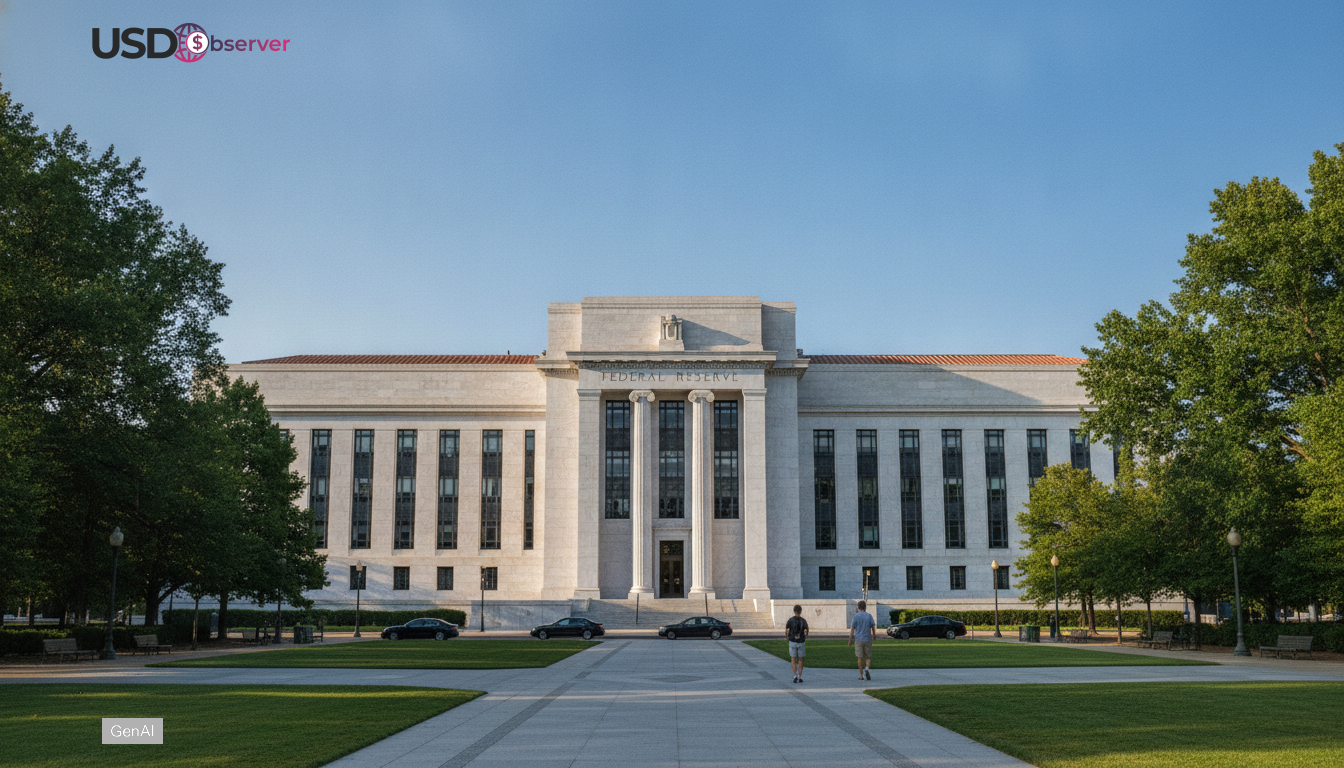
The Federal Reserve’s decision to raise rates in December 2015 — the so-called “liftoff” after seven years at the zero lower bound — marked a turning point for global markets and the U.S. dollar. Over the next three years, the Fed implemented a steady series of hikes, eventually pausing in 2019. For forex traders, the 2015–2018 cycle was a case study in how interest-rate decisions, macro data, and external factors converge to shape dollar dynamics.
A Gradual Hike Cycle
After the financial crisis, rates remained at 0–0.25% from 2008 through late 2015. The December 2015 hike to 0.50% was symbolic — signaling confidence in recovery. The dollar strengthened in anticipation, with the DXY rising more than 20% in the two years leading up to liftoff.
From 2016 through 2018, the Fed raised rates eight more times, reaching 2.50%. The gradual pace, coupled with balance-sheet runoff (“quantitative tightening”), tightened financial conditions and supported the dollar, particularly against low-yielding currencies like the yen and euro.
Economic Indicators: MoM and YoY
The Fed’s tightening path was underpinned by strong macro data:
- Employment: Nonfarm payrolls grew consistently at +150k to +200k MoM, while unemployment fell from 5.7% in early 2015 to 3.9% by mid-2018. Wage growth, measured by average hourly earnings, accelerated from ~2% YoY in 2015 to above 3% by 2018.
- Inflation: Core CPI hovered between 1.5–2.3% YoY, gradually converging toward the Fed’s 2% target. PCE inflation, the Fed’s preferred measure, trended slightly lower but moved upward by 2018.
- Crime and Social Indicators: FBI data showed modest declines in violent crime rates from 2016–2018, supporting the narrative of a stable domestic backdrop.
- Environmental Factors: NOAA data showed several billion-dollar disasters in 2017 — hurricanes Harvey, Irma, and Maria — which disrupted local economies but did not derail national growth.
These MoM and YoY metrics gave the Fed justification for continuing hikes, while traders saw them as signals to maintain dollar bullish positioning.
External Factors and Dollar Performance
The dollar’s performance was not linear. After strengthening into 2016, the DXY stalled in 2017 as political uncertainty and global growth momentum supported other currencies. Still, the tightening cycle created a structural floor under the greenback, limiting downside.
By late 2018, rising concerns about global growth and financial market volatility (including a sharp equities sell-off) led the Fed to pause. The dollar peaked mid-2018 before retracing as markets priced in a slower U.S. economy.
Lessons for Traders
The 2015–2018 cycle highlighted three takeaways:
- Anticipation matters: The dollar rallied before liftoff, showing that forward guidance can move FX markets ahead of action.
- MoM and YoY signals are key: Payroll gains, wage growth, and inflation prints consistently reinforced dollar strength.
- External shocks can limit dollar upside: Hurricanes, political gridlock, and global growth surges temporarily tempered the dollar’s rally.
For forex traders, the “liftoff to pause” period remains a template for how the Fed’s normalization cycles interact with macro data and external stressors to shape the dollar’s trajectory.