The gold-to-copper ratio acts as a real-time barometer of global growth versus risk aversion, offering traders a powerful guide for anticipating dollar cycles.
By Mattia Landoni | NY Fed Researcher
Introduction
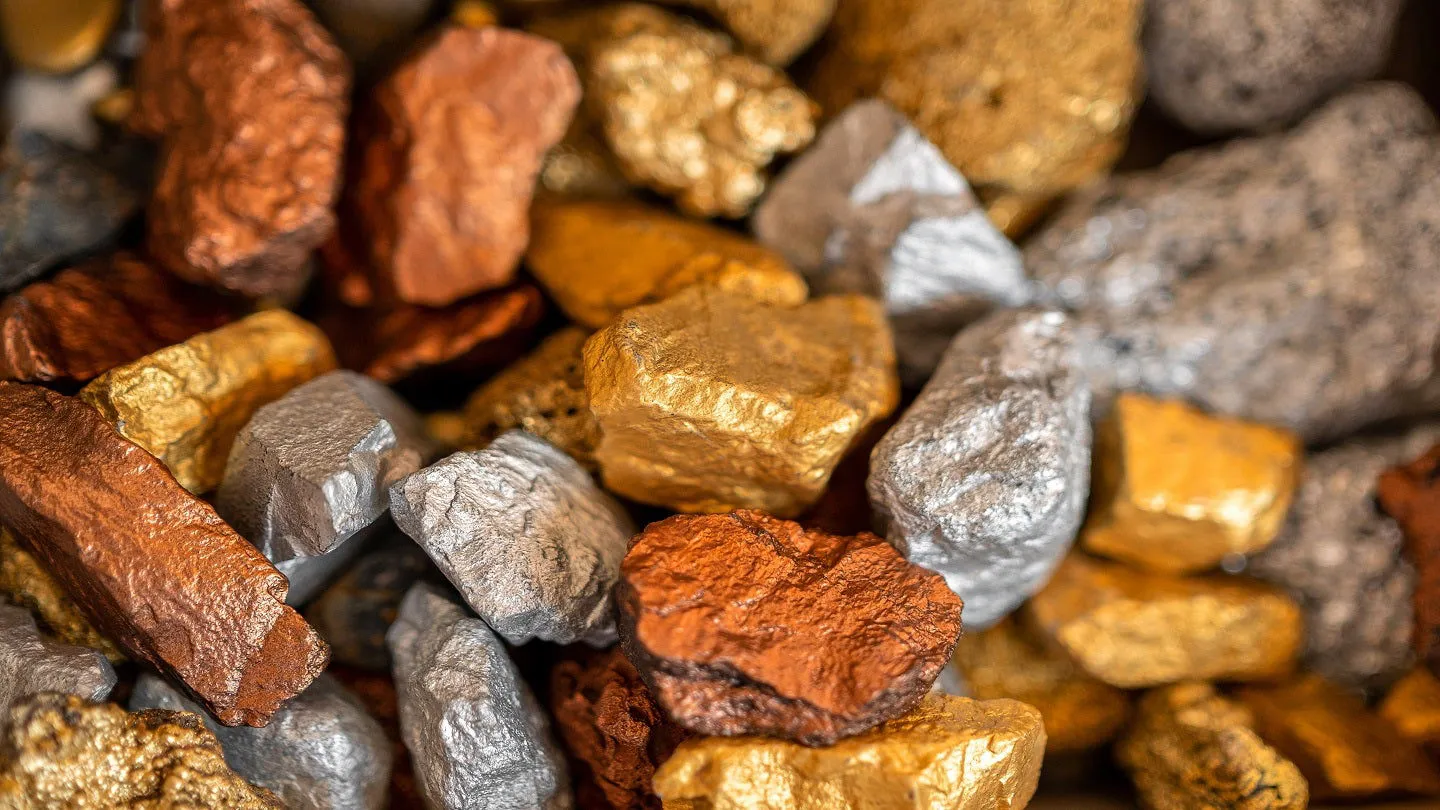
Markets often rely on complex models to forecast growth, inflation, and dollar flows, but sometimes the simplest ratios tell the clearest story. One such measure is the gold-to-copper ratio — a comparison of safe-haven demand versus industrial demand. Gold typically rallies in times of fear and falling yields, while copper rises during periods of robust industrial activity. When the ratio is high, it signals risk aversion and potential dollar strength. When low, it points to global expansion and weaker USD demand as capital flows to risk-sensitive assets. For forex traders, the gold/copper ratio has emerged as a reliable “macro compass,” offering real-time insight into how growth expectations and risk sentiment intersect with dollar positioning.
How the Ratio Works
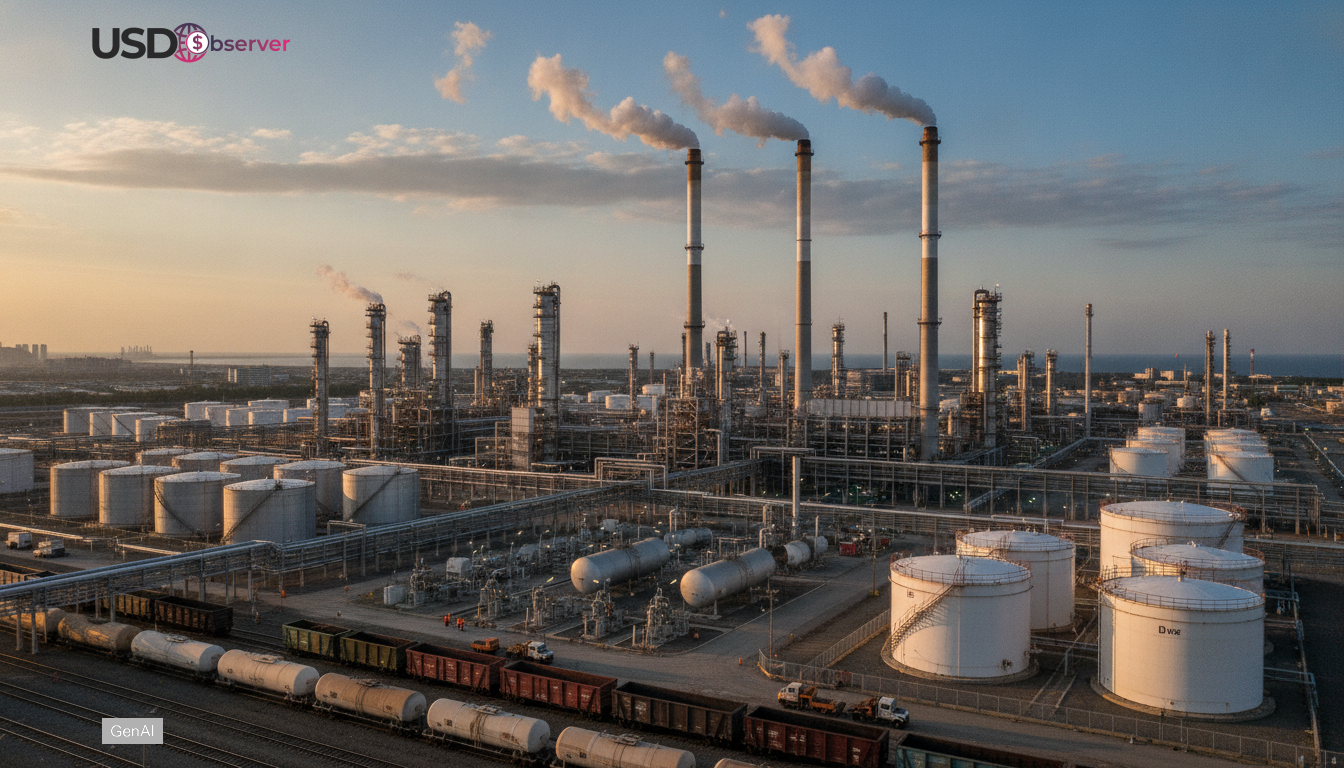
Gold and copper embody two sides of the market narrative. Gold reflects caution, monetary debasement fears, and safe-haven demand. Copper, dubbed “Dr. Copper,” signals growth optimism, infrastructure spending, and industrial momentum. By comparing their prices, the ratio compresses this tension into a single metric. When gold outperforms copper, it usually indicates global slowdown fears, reinforcing dollar safe-haven flows. When copper outpaces gold, risk appetite is healthy, and the dollar tends to weaken against commodity currencies.
MoM and YoY Data Context
- Gold: Averaged $1,950/oz in 2024, up 14% YoY.
- Copper: Traded near $8,300/tonne in 2024, down 12% YoY.
- Ratio: Rose sharply in 2022 during Fed tightening as gold held steady while copper collapsed, coinciding with an 8% YoY surge in the DXY.
MoM fluctuations in 2023–24 highlighted smaller shifts: when copper prices gained +2% MoM while gold remained flat, the ratio fell, leading to softer USD moves against AUD and CAD.
External Shocks Driving the Ratio
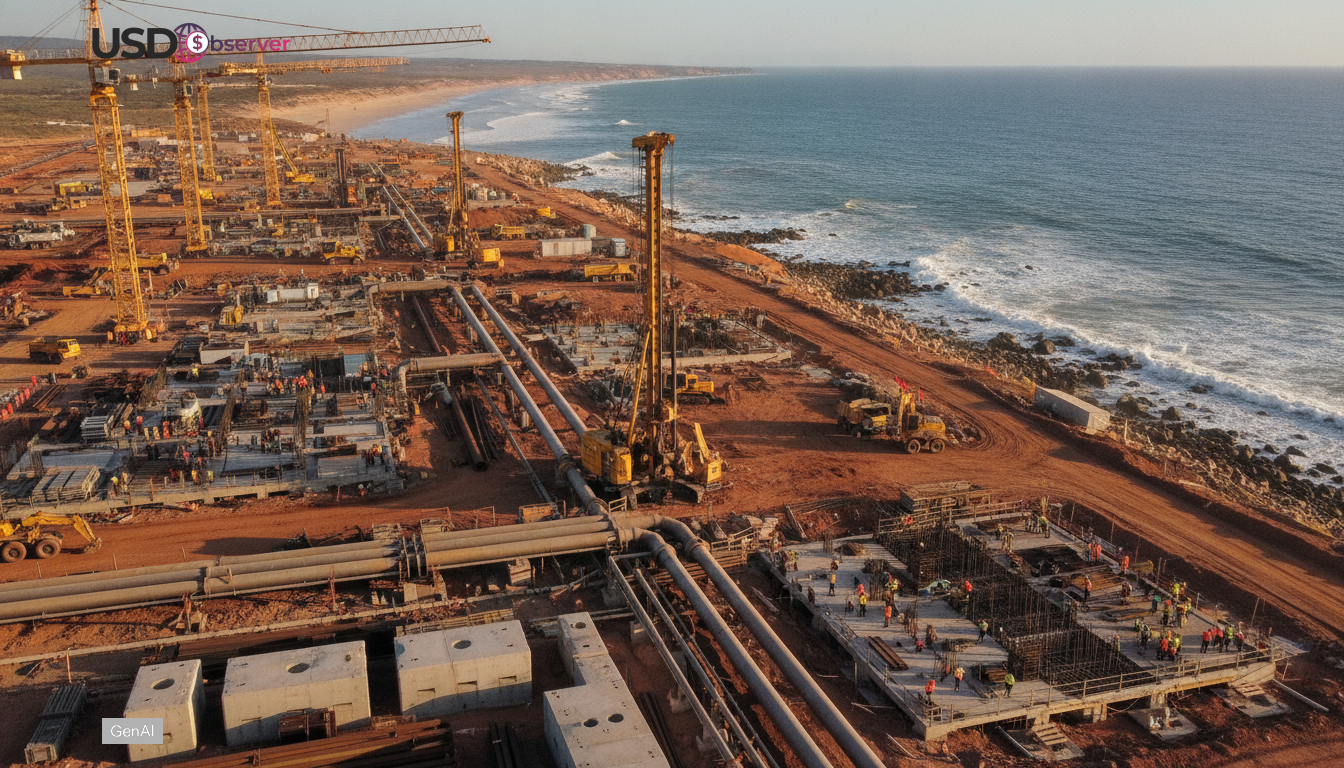
- Climate: Extreme weather impacts both mining output and agricultural demand, feeding into commodity cycles that move the ratio.
- Crime & Governance: Corruption scandals in resource-rich nations like Peru or South Africa disrupt copper supply, amplifying gold’s relative strength.
- Geopolitics: Wars and sanctions raise demand for gold as a safe haven, pushing the ratio higher and reinforcing USD safe-haven flows.
Lessons for Traders
The gold/copper ratio should not be viewed in isolation but as part of a macro toolkit. Traders who track MoM shifts in the ratio alongside YoY inflation and employment data gain a clearer picture of where the dollar is headed. A rising ratio signals heightened risk aversion — often USD positive. A falling ratio signals growth optimism — usually USD negative. Importantly, the ratio tends to lead shifts in FX positioning, making it a useful early-warning system.
Takeaway
The gold/copper ratio distills global risk appetite into a single number with direct implications for the dollar. It is not perfect, but it captures the interplay between fear and growth better than most indicators. For dollar traders, keeping one eye on this ratio is like checking a compass — it doesn’t tell you the destination, but it does keep you oriented in the right direction.