Crime, climate, and geopolitics as overlooked but critical USD drivers over the past decade.
By Alexander Baker | Researcher, Macroeconomics & Crypto Policy
The U.S. dollar’s trajectory over the past decade cannot be explained by interest rates alone. From the post-crisis “lower-for-longer” era of the 2010s to the pandemic shock and tightening cycle of the 2020s, the greenback’s role has been shaped as much by external stressors — crime, climate, geopolitics — as by Federal Reserve policy. For traders and analysts, the lesson is that USD analysis demands a broader lens.
The 2010s: Low Rates, Strong Dollar
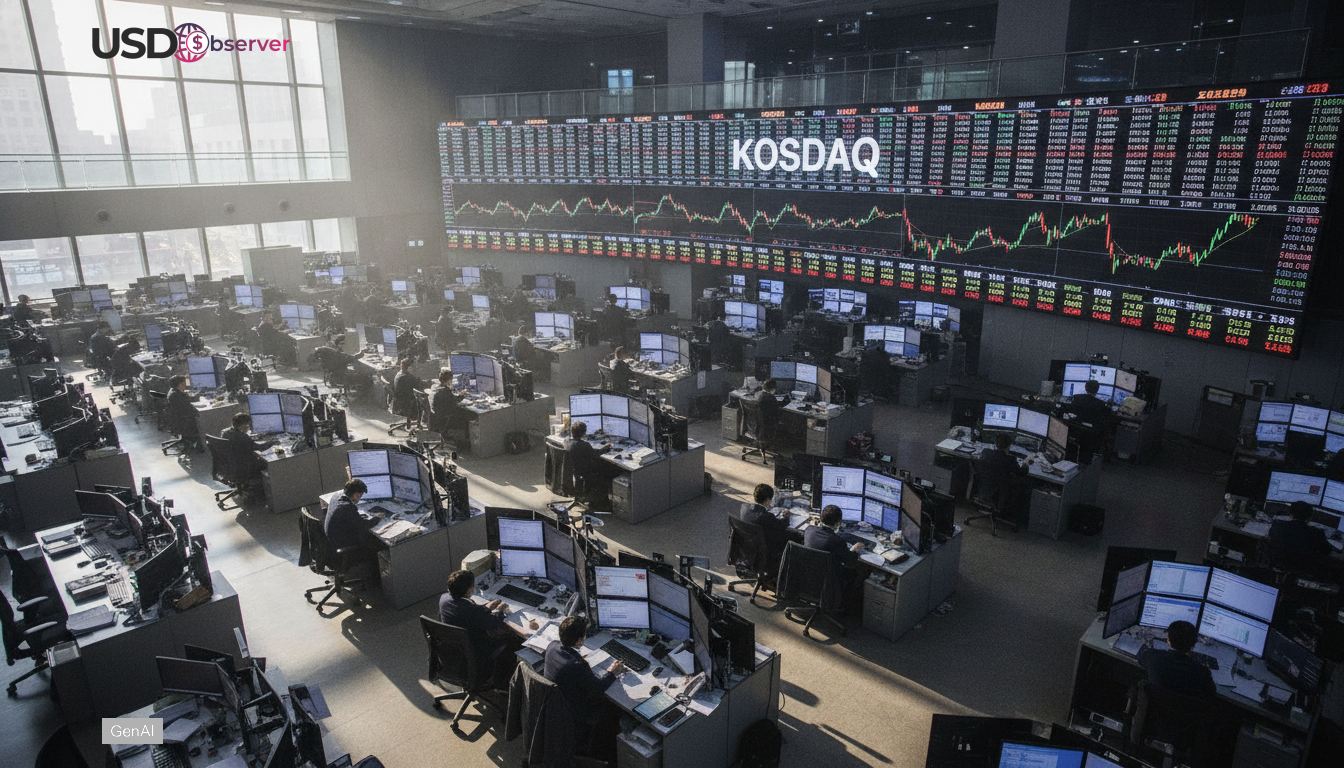
After the 2008 financial crisis, the Fed held rates near zero until 2015. Conventional models suggested this should weaken the dollar. Instead, the opposite occurred: the DXY rallied more than 25% between 2014 and 2016. Divergent policy was the key. While the Fed prepared for liftoff, the ECB and BOJ were still expanding QE, widening yield differentials in the dollar’s favor.
MoM and YoY Indicators: Employment and Stability
- Employment: Nonfarm payrolls consistently added ~200k per month from 2014–2018, pushing unemployment from 6.7% in 2014 to 3.9% by 2018.
- Wages: Wage growth rose gradually, from 2.0% YoY in 2014 to 3.2% by 2019.
- Inflation: Core PCE hovered between 1.5–2% YoY, undershooting targets but justifying gradual hikes.
- Crime Rates: FBI data showed violent crime trending lower through most of the 2010s, reinforcing perceptions of domestic stability that supported capital inflows.
These MoM and YoY data points underpinned confidence in U.S. assets, even with “low for long” rates.
The Pandemic Era: Shock and Disruption
The 2020 collapse flipped the script. Employment fell by 20.5 million in April alone, unemployment surged to 14.7%, and CPI dropped -0.8% MoM. The Fed slashed rates to zero and unleashed record QE, yet the dollar surged temporarily on liquidity stress. External factors amplified the shock: crime rates spiked in urban centers, while NOAA reported 22 billion-dollar climate disasters that compounded fiscal costs.
The 2020s: Inflation, Rates, and Beyond
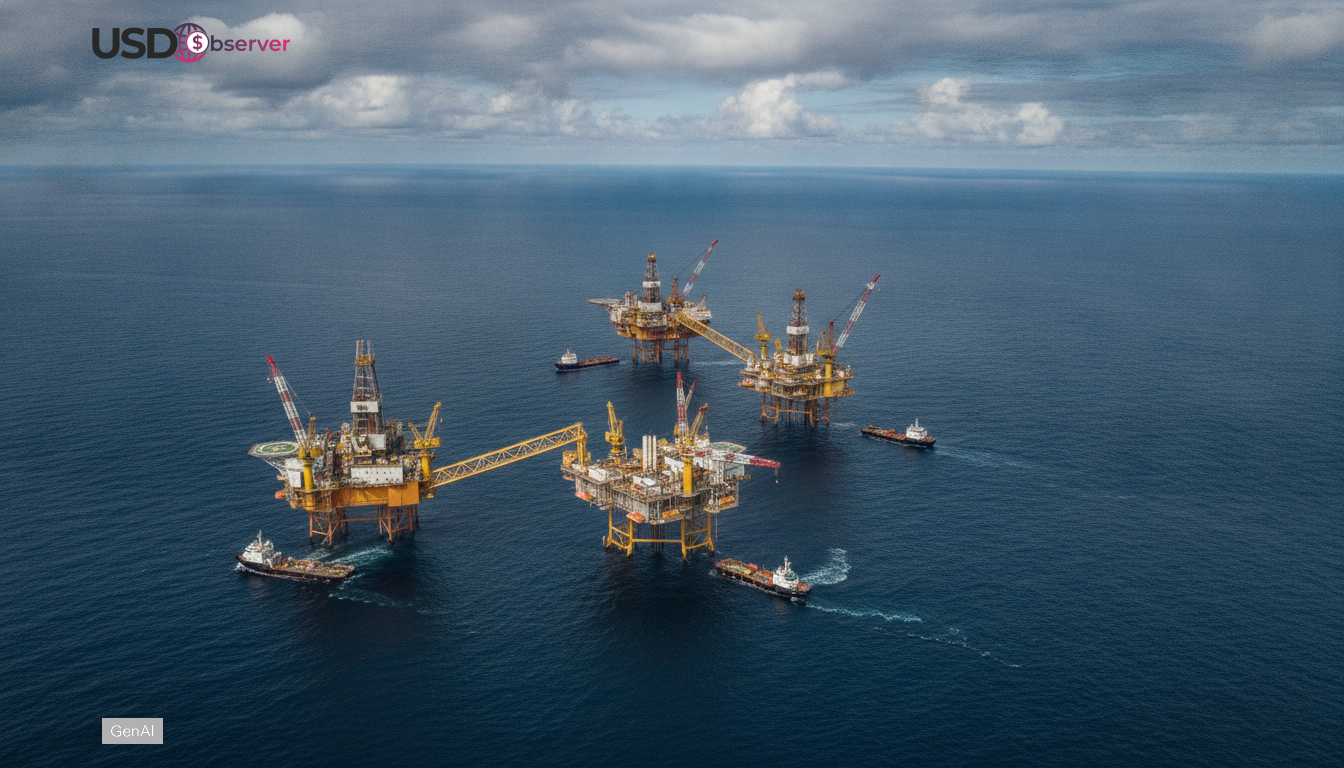
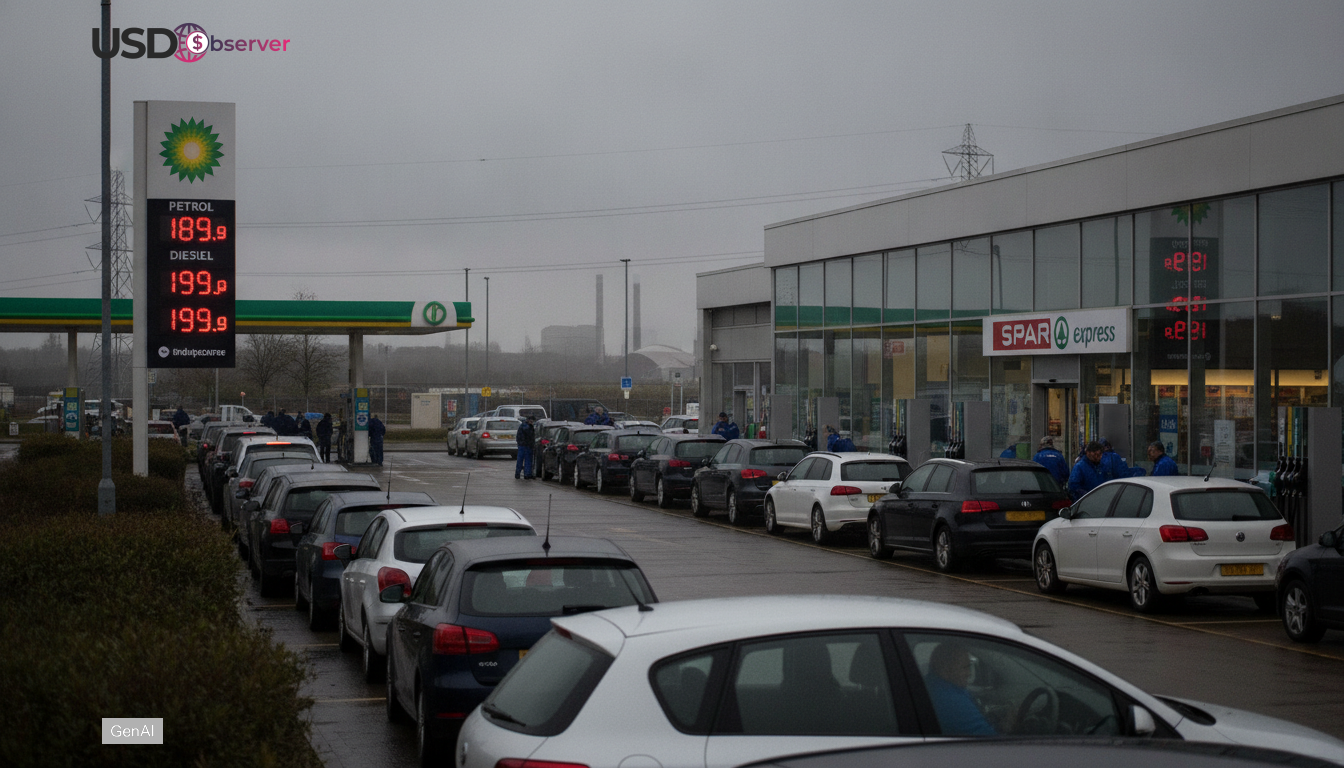
From 2021 to 2023, inflation surged to 9.1% YoY at its peak, forcing the Fed into the fastest hiking cycle since the 1980s. Yet the dollar’s strength was also shaped by geopolitics. Russia’s invasion of Ukraine in 2022 fueled commodity price spikes, reinforced dollar safe-haven flows, and pressured EM currencies.
By 2024, as inflation moderated, the Fed embraced “higher-for-longer.” Employment growth slowed (+150k MoM), unemployment edged to 4.2%, and wages cooled to ~3.8% YoY. But fiscal deficits and record climate-related costs (25+ billion-dollar disasters) added new risks to U.S. sustainability, complicating dollar narratives.
Lessons Across the Decade
Three insights emerge from a decade of data:
- Relative policy, not absolute levels, drives USD. Even at zero, the dollar can rally if peers are looser.
- MoM and YoY prints define cycles. Payrolls, CPI, and wages remain the benchmarks that traders price daily.
- External shocks now matter more. Crime trends, climate disasters, and geopolitical stress increasingly shape perceptions of U.S. stability and fiscal sustainability.
Looking Ahead
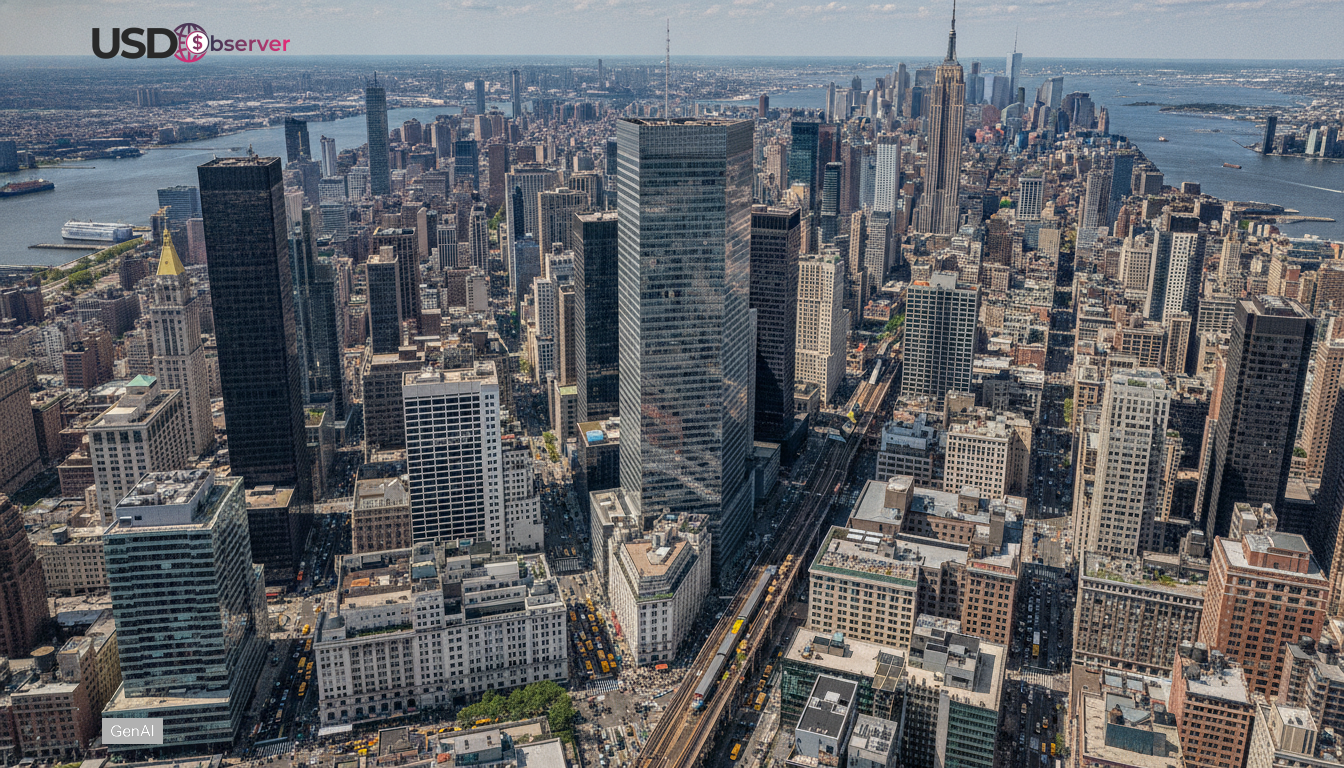
As 2025 begins, the dollar sits at the intersection of structural and cyclical forces. Interest rates remain elevated, but the real questions are fiscal sustainability, climate adaptation costs, and geopolitical fragmentation. For forex traders, the past decade is clear proof: the dollar is no longer just a Fed story — it is the world’s shock absorber.